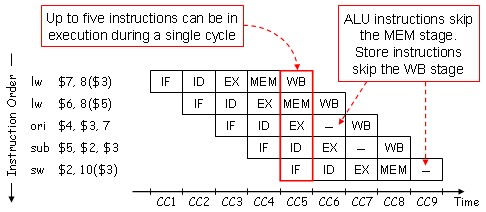
Pipelining can be difficult to understand, since many instructions are simultaneously executing in a single datapath in every clock cycle. To aid understanding, the following figure shows a multiple-clock-cycle pipeline diagram of five instructions. This style of pipeline representation shows the complete execution of instructions in a single figure.
| Instructions are listed in instruction execution order from top to bottom, and clock cycles move from left to right. |

|
This representation breaks the register file into two logical parts:
- registers read during register fetch (ID) and
- registers written during write back (WB).
| Another way of showing the pipelines is given in the figure. It is the traditional multiple-clock-cycle pipeline diagram. |
|
|
I have to get up at 5 tomorrow morning. It is time to hit the hay (go to bed). |