# Three lines to make Python compiler able to draw:
import sys
import matplotlib
matplotlib.use( 'Agg' )
import matplotlib.pyplot as plt
from sklearn.neighbors import KNeighborsClassifier
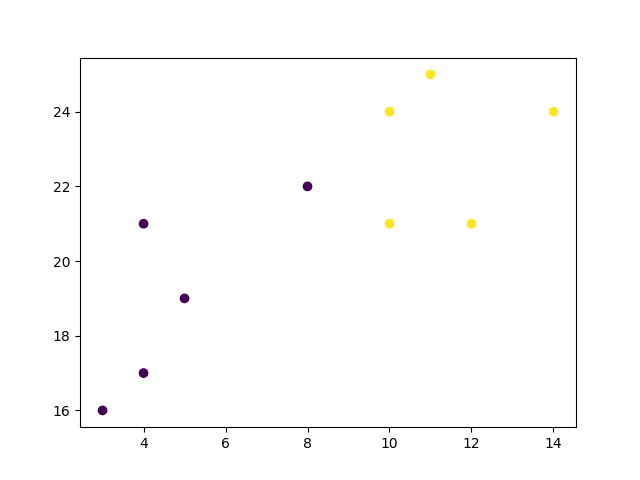
x = [ 4, 5, 10, 4, 3, 11, 14, 8, 10, 12 ]
y = [ 21, 19, 24, 17, 16, 25, 24, 22, 21, 21 ]
classes = [ 0, 0, 1, 0, 0, 1, 1, 0, 1, 1 ]
data = list( zip( x, y ) )
knn = KNeighborsClassifier( n_neighbors=5 )
# Fit a kNN model on the model using 5 nearest neighbors.
knn.fit( data, classes )
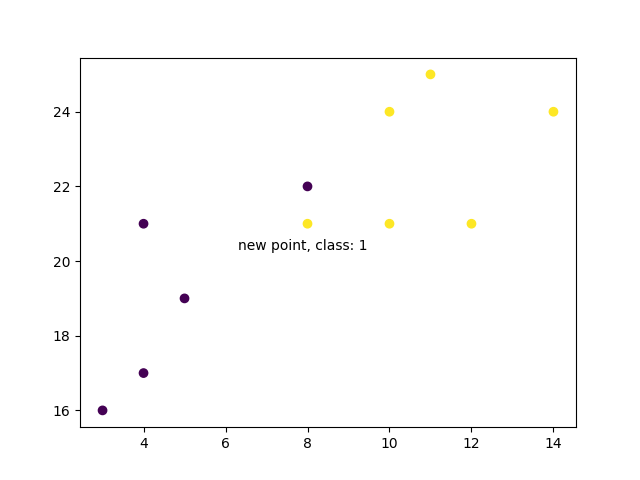
new_x = 8
new_y = 21
new_point = [( new_x, new_y )]
# Predict the class of new, unforeseen data points.
prediction = knn.predict( new_point )
plt.scatter( x + [new_x], y + [new_y], c=classes + [prediction[0]] )
plt.text( x=new_x-1.7, y=new_y-0.7, s=f"new point, class: {prediction[0]}" )
plt.show( )
# Two lines to make Python compiler able to draw:
plt.savefig( sys.stdout.buffer )
sys.stdout.flush( )
|
|