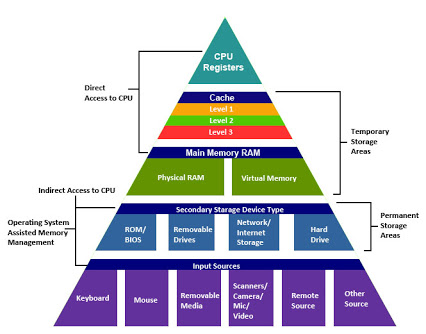
| The following table shows the key quantitative design parameters that characterize the major elements of memory hierarchy as shown on the right. These are typical values for these levels as of 2012. |

|
Although the range of values is wide, this is partially because many of the values that have shifted over time are related; for example, as caches become larger to overcome larger miss penalties, block sizes also grow. While not shown, server microprocessors today also have L3 caches, which can be 2 to 8 MiB and contain many more blocks than L2 caches. L3 caches lower the L2 miss penalty to 30 to 40 clock cycles.
| Feature | Typical Values for L1 Caches | Typical Values for L2 Caches | Typical Values for Paged Memory | Typical Values for a TLB |
|---|---|---|---|---|
| Total size in blocks | 250-2000 | 2,500-25,000 | 16,000-250,000 | 40-1024 |
| Total size in kilobytes | 16-64 | 125-2000 | 1,000,000-1,000,000,000 | 0.25-16 |
| Block size in bytes | 16-64 | 64-128 | 4000-64,000 | 4-32 |
| Miss penalty in clocks | 10-25 | 100-1000 | 10,000,000-100,000,000 | 10-1000 |
| Miss rates (global for L2) | 2%-5% | 0.1%-2% | 0.00001%-0.0001% | 0.01%-2% |
|
“Employ your time in improving yourself by other men’s writings so that you shall come easily by what others have labored hard for.” ― Socrates |