Worldwide Computer and Device Sales
The PC and mobile phone worldwide sales are given in the following table according to various market research reports. It shows the sales of computers and devices are slowing down because of market saturation.
| Year | Numbers of Units Shipped (Million) | ||||
|---|---|---|---|---|---|
| Feature phones | Smartphones | PCs and servers | Tablet PCs | PDAs (without phone capabilities) | |
| 2002 | 432 | — | 148 | — | 12.1 |
| 2003 | 520 | — | 169 | — | 11.5 |
| 2004 | 713 | — | 189 | — | 12.5 |
| 2005 | 813 | — | 209 | — | 14.9 |
| 2006 | 927 | 64 | 239 | — | 16.7 |
| 2007 | 1,031 | 122 | 271 | — | — |
| 2008 | 1,081 | 139 | 302 | — | — |
| 2009 | 1,055 | 166 | 306 | 1 | — |
| 2010 | 1,609 | 286 | 346 | 17 | — |
| 2011 | 1,323 | 486 | 365 | 73 | — |
| 2012 | 1,048 | 698 | 352 | 128 | — |
| 2013 | 838 | 968 | 296 (PCs only) | 195 | — |
| 2014 | 634 | 1,245 | 314 (PCs only) | 227 | — |
| 2015 | 486 | 1,424 | 290 (PCs only) | 207 | — |
| 2016 | 396 | 1,495 | 270 (PCs only) | 175 | — |
| 2017 | — | 1,537 | 263 (PCs only) | 164 | — |
| 2018 | — | 1,555 | 259 (PCs only) | 174 | — |
| 2019 | — | 1,541 | 261 (PCs only) | 145 | — |
| 2020 | — | 1,348 | 295 (PCs only) | 164 | — |
| 2021 | — | 1,434 | 340 (PCs only) | 169 | — |
| 2022 | — | 1,395 | 287 (PCs only) | 137 | — |
| 2023 | — | 1,167 | 251 (PCs only) | 135 | — |
| 2024 | — | 1,236 | 263 (PCs only) | 148 | — |
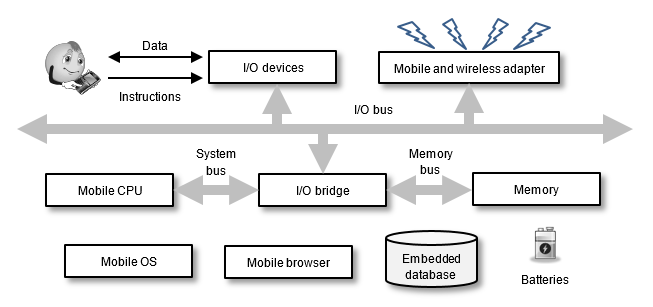
A Mobile Handheld Device Structure
The figure shows a generic system structure of handheld devices, which includes the following six major components: (i) mobile OS, (ii) mobile CPU, (iii) mobile browser, (iv) input and output components and methods, (v) memory and storage, and (vi) batteries.
